Playing with canvas
Today I’m tired of server-side programming.. And yes, I’m looking at you, SQL ! It’s a pain to persist objects naturally when you have complex data structures. And switching to smarter alternatives such as Riak is not an option since I’m coding for $WORK. So I decided to work on something else.
There are a lot of things to explore in my sysadmin world : high availability, security, monitoring, capacity planning, logs correlation, performance tuning, databases, automated deployments, networking, backups, storage, messaging, virtualization, config management, versionning, etc. There are also many subjects on the management or client relations sides : basically it’s everything that is treated under ITIL, including configuration database (CMDB), provisioning, treating support requests/incidents/problems/changes, building reporting/dashboards, contracts, etc.
I don’t love them all the same way. I even hate a few of them because of the stupid way they’re treated. Anyway, I can’t explore all of the remaining ones. These days I’m really passionate about CMDB and config management, and how I can integrate it with the gazillions of tools we use every day. It’s a hard thing, and I think visualizing things is one of the major lack in today tools. There are some cool things in Service-Now though, but I’m not that rich (and the “diagrams” part is not worth the price).
This night, I started to work on a visual output for the CMDB I build these days. I want to be able to build diagrams for the applications I host, at least semi-automatically. They should represent servers, arrows for network traffic, active/passive clustering, and basic components on each server. Later, I plan to make it dynamic so we can display either components, network parameters, physical machine, location, and maybe even integrate it with the monitoring system so that it eases problems resolution. But enough for the dreams.
I started with a basic canvas and some jQuery to make elements “draggable”, with collision detection. I already had
boxes, with some piece of code for dynamically drawing arrows between the boxes. Then with ruby and erb, I made it a bit more
dynamic (data are in nested hashes/arrays for now, but it could well have been data extracted from a database). I added some intelligence (on the ruby side,
maybe I’ll need to port it to javascript) to position elements automatically, depending on the number of elements on the line, and the elements type. Then I
added signs to represent active/passive clusters (hearts for heartbeat and “R” for redhat clusters).
Here’s the result for now :
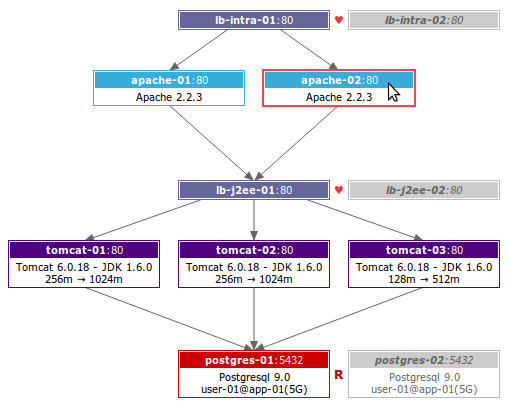
Boxes are auto-positionned, draggable, they cannot collide, and they’re re-drawn with each drag event. Cluster signs don’t follow their boxes though, because boxes in a same cluster are not linked together for now.
But now I have a problem : I’d like to be able to click on links between servers, to group elements, to provide animations… and it seems it’s not that easy with canvas. Tomorrow I’ll try to explore SVG with the awesome raphaeljs library, and see where it leads.
The second problem I have is my (very) limited skills in Javascript. My code is ugly and not so organized, not even tested. It’s mainly because I always find javascript syntax itself ugly. I’ll try to use CoffeeScript as a therapy to build a smarter component, and if it looks good, I’ll put it on Github.